FUMO 200 MagnetWhat it does
FUMO Magnet measures how far price has stretched away from its long-term “magnet” — a blended EMA/SMA moving average (200 by default).
It plots a logarithmic deviation (optionally normalized) as an oscillator around zero.
Above 0** → price is above the magnet (stretched up)
Below 0** → price is below the magnet (stretched down)
Guide levels** highlight potential overbought/oversold zones
---
Why log deviation?
Log returns make extremes comparable across cycles and compress exponential trends — especially useful for BTC and other crypto assets.
Normalization modes further adjust the scale, keeping the oscillator readable on any chart.
---
Inputs
**Base**
* Source (default: Close)
* Base Length (default: 200 EMA/SMA)
* EMA vs SMA weight (%) — 0% = pure SMA, 100% = pure EMA, 50% = blended
* EMA smoothing of deviation — acts as a noise filter
**Normalization**
* None (Log Deviation) — raw log stretch in % terms
* Z-score — deviation in standard deviations (σ)
* Robust Z (MAD) — deviation vs median absolute deviation, resistant to outliers
* Tanh squash — smooth nonlinear squash of extremes for compact scale
* Normalization window (for Z / MAD)
* Tanh scale (lower = stronger squash)
* Clamp after normalization — hard cap at ±X
**Levels**
* Guide levels (Upper / Lower) — visual thresholds (default ±12)
* Zero line toggle
---
### How to read it
* **Trend bias**: sustained time above 0 = uptrend, below 0 = downtrend
* **Stretch / mean reversion**: the farther from 0, the higher the reversion risk
* **Cross-checks**: combine with structure (HH/HL, LH/LL), volume, or momentum (RSI, MACD)
---
### Recommended settings by timeframe
**Long-term (1D / 1W)**
* Normalization: None (Log Deviation)
* Base Length: 200
* EMA vs SMA weight: 50% (adjust 35–65% for faster/slower magnet)
* Deviation smoothing: 20 (10–30 range)
* Guide levels: ±12 to ±20
* Use case: cycle extremes, portfolio rebalancing, trim/add logic
**Swing (4H – 1D)**
* Normalization: Z-score
* Window: 200 (100–250)
* Smoothing: 14–20
* Guide levels: ±2σ to ±3σ
* Use case: stretched conditions across regimes; ±3σ is rare, often mean-reverts
**Intraday / Active swing (1H – 4H)**
* Normalization: Robust Z (MAD)
* Window: 200 (150 for faster response)
* Smoothing: 10–16
* Guide levels: ±3 to ±4 (robust units)
* Use case: handles spikes better than σ, fewer false overbought/oversold signals
**Scalping / Universal readability (15m – 1H)**
* Normalization: Tanh squash
* Tanh scale: 6–10 (start with 8)
* Smoothing: 8–12
* Guide levels: ±8 to ±12
* Use case: compact panel across assets and timeframes; not % or σ, but visually consistent
---
### Optional
* Clamp: enable ±20 (or ±25) for strict bounded range (useful for public charts)
---
### Quick setups
**BTC Daily (“cycle view”)**
* Normalization: None
* Blend: 50%
* Smooth: 20
* Levels: ±12–15
**BTC 4H (“swing”)**
* Normalization: Z-score
* Window: 200
* Smooth: 16
* Levels: ±2.5σ to ±3σ
**Alts 1H (“volatile”)**
* Normalization: Robust Z (MAD)
* Window: 200
* Smooth: 12
* Levels: ±3.5 to ±4.5
**Mixed assets 15m (“compact panel”)**
* Normalization: Tanh squash
* Scale: 8
* Smooth: 10
* Levels: ±8–12
* Clamp: ±20
在腳本中搜尋"RSI MACD"

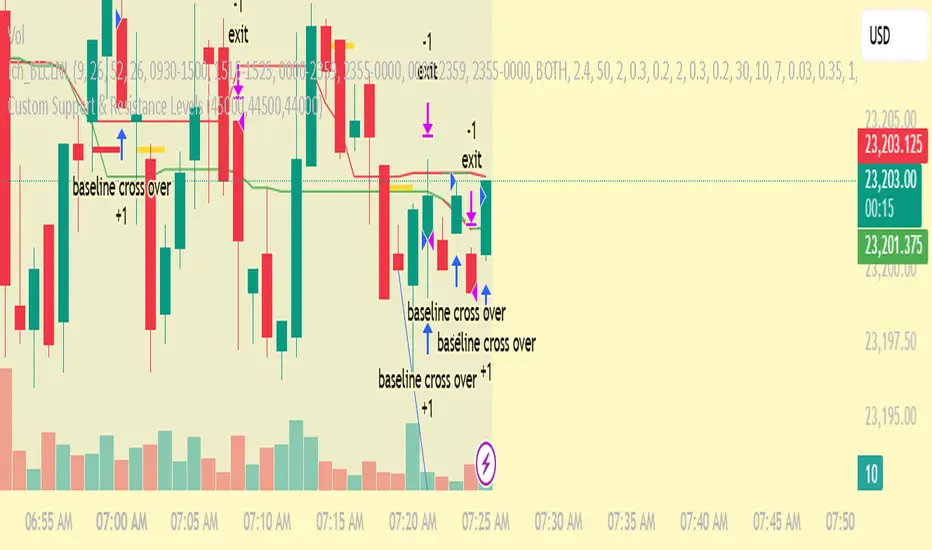
Custom Support & Resistance LevelsThe Smart Auto Trendline Indicator is designed to help traders quickly identify key market trends without the need for manual drawing. It automatically detects swing highs and lows, plots dynamic trendlines, and updates them in real-time as price evolves.
This tool is especially useful for traders who rely on trendline breakouts, pullback entries, or reversal confirmations. By simplifying chart analysis, it saves time and ensures more consistent results.
Key Features:
🔹 Automatic detection of valid swing highs and lows
🔹 Dynamic trendline plotting (auto-adjusts as price moves)
🔹 Highlights potential breakout and breakdown zones
🔹 Works on all timeframes and instruments (Forex, Stocks, Indices, Crypto)
🔹 Clean, non-intrusive design to keep charts clear
🔹 Customizable settings (line color, style, sensitivity)
How to Use:
Apply the indicator to your chart.
Observe automatically drawn trendlines.
Watch for breakouts above/below trendlines for trade entries.
Use in combination with other tools like RSI, MACD, or support/resistance for stronger confirmation.
Best For:
Breakout traders
Swing traders
Trend followers
Forex, Stocks, Crypto, Indices
Auto Fib V2Auto Fib V2 — Advanced Fibonacci Mapping Tool
Introduction
Auto Fib V2 is an advanced Fibonacci retracement indicator that automatically adapts to recent market ranges. Rather than manually drawing Fibonacci lines, this script dynamically maps them based on the most recent highs and lows, allowing traders to see the chart as if it were a "navigation map." Its primary purpose is to help identify potential buy and sell zones with greater clarity.
Key Concept
The script is built on a simple but powerful interpretation of Fibonacci retracement:
When the price moves below the 0.236 level, it suggests an oversold zone, where buyers may step in and market reversal potential increases.
When the price rises above the 0.764 level, it highlights an overbought zone, where sellers may become more active and risk of reversal grows.
Between these extremes, the Golden Pocket (0.382–0.618 zone) is highlighted as the area where institutional traders and algorithms often react. Historically, this is one of the most respected Fibonacci areas in technical analysis.
Features & Customization
Automatic Range Detection: The indicator automatically finds the recent high/low (based on user-defined lookback bars) and applies Fibonacci levels.
Flexible Direction Setting: Traders can use Auto Mode to let the script decide direction from price movement, or manually choose upward/downward mapping.
Multiple Levels Display: Beyond the standard levels, extra fractional retracements (0.146, 0.309, 0.441, etc.) are included for more precise mapping.
Golden Pocket Highlighting: Visually emphasizes the 0.382–0.618 retracement zone for quick recognition.
Custom Styles: Switch between line-based and dot-based plotting, with adjustable colors and transparency for improved readability.
Practical Use
Auto Fib V2 is not intended as a direct buy/sell signal generator, but as a contextual guide. Traders can use it to:
Confirm whether the current price area is closer to an overbought or oversold condition.
Combine it with oscillators (RSI, MACD) or trend indicators (EMA, ADX) to strengthen trading decisions.
Identify confluence zones where Fibonacci levels overlap with key supports/resistances.
Quickly adapt to market shifts without the need to redraw Fibonacci retracement lines repeatedly.
Why Use Auto Fib V2?
Manual Fibonacci drawing can be subjective, often depending on the swing points a trader chooses. Auto Fib V2 reduces that subjectivity by using consistent logic, creating a more systematic approach. For intraday traders, it provides rapid context to assess whether the market is stretched or balanced. For swing traders, it offers a map of reaction zones across higher timeframes.

MultiFactor Power Indicator v4 (No-Repaint) 📊 Strategy: Trend + Momentum + Signal Confirmation
This setup uses 3 layers so signals are reliable:
1. Trend Filter: 200 EMA → only take trades in trend direction.
2. Momentum Trigger: RSI + MACD combo to confirm momentum.
3. Entry/Exit Signal: Arrow on chart (Buy/Sell) with alerts — non-repainting because it only confirms on candle close.

TrendLines with ATR and MA [KoTa]The "TrendLines with ATR and MA " indicator combines trend lines, breakout signals, ATR-based trend tracking, and moving averages (MA).
Input Settings and Customization:
After adding the indicator, click on its name at the top of the chart and open the "Settings" tab.
Main sections:
Trend Lines and Breakouts (Periods 1-5):
General Usage Tips:
Chart Timeframe: Works on any timeframe (from 1 minute to weekly). Shorter timeframes (e.g., 5-minute) generate more signals, while longer timeframes (e.g., daily) produce fewer but more reliable signals.
Compatibility: Overlay=true, meaning it is drawn directly on the candlestick chart. It can be combined with other indicators (e.g., RSI, MACD).
Advantages
This indicator outperforms standard trend line tools due to its automated, multi-period, and integrated features:
Automated Trend Line Drawing: Instead of manual drawing, it creates trend lines based on pivot highs/lows. Different periods (3-50) enable multi-timeframe analysis, allowing you to see short- and long-term trends on the same chart.
Breakout Detection and Labeling: Detects breakouts in real-time using dotted extensions. B (Buy) and S (Sell) labels (e.g., B1 for period1 up breakout) clarify signals. Historical breakouts are shown in gray for context.
ATR Integration: Volatility-based trend tracking (similar to SuperTrend). Calculates channel deviation to adapt to market volatility. Arrows highlight trend reversals quickly.
Moving Averages Integration: Flexible MA types (e.g., VWMA for volume-weighted analysis) for trend filtering. No Bollinger Bands option, but MAs can validate breakouts.
Performance and Visuals: Limits line count with max_lines_count for memory efficiency. Colors and line widths are customizable, and old elements are automatically managed (deleted or grayed out). Precision=0 ensures clean price formatting.
Flexibility: All components (trend lines, ATR, MA) can be toggled on/off, allowing for simple or complex usage.
Benefits Provided
This indicator speeds up trading decisions and reduces errors:
Trend and Support/Resistance Detection: Pivot-based lines provide automatic support (green, lows) and resistance (red, highs) levels. Benefit: Reduces manual analysis time, saving effort in scalping or swing trading.
Breakout Signals: Signals are triggered when the close price crosses over/under the extended line. Benefit: Catches potential trend starts early; ATR can filter false breakouts. B/S labels provide visual alerts, simplifying alert setup.
Volatility Adaptation (ATR): Adjusts trend lines based on market fluctuations. Benefit: Wider channels in high-volatility periods (e.g., crypto) and narrower in low volatility, reducing whipsaws (false signals). Arrows clearly show trend changes, ideal for position management.
MA Validation: MAs measure trend strength (e.g., EMA20 above indicates uptrend). Benefit: Filtering breakouts with MA crossovers improves accuracy. VWMA offers volume-based analysis to eliminate weak trends.
General Benefits:
Risk Management: Breakout levels can be used for stop-loss placement (e.g., below breakout).
Profit Potential: When tested on historical data (backtesting), it can be optimized by period—shorter periods for quick entries, longer for holding.
Educational Value: Visualizes fractal, pivot, and ATR concepts for new traders.
Time Savings: Automation eliminates hours of chart analysis; updates in real-time.
Multi-Asset Compatibility: Works for stocks, forex, and crypto; ATR shines in volatile assets.
Possible Strategies
This indicator supports various strategies, primarily focused on breakouts and trend following, enhanced by MA and ATR filtering.
Breakout Trading Strategy:
Rules: Enter long on B (Buy) label (crossover up line), short on S (Sell). For example, enter on B3 (period10), with stop-loss below the previous pivot low.
Filtering: Confirm with ATR arrow up (trend=0). Ensure price is above MA1 (20).
Exit: Profit target at ATR*2 or exit on reverse breakout (S).
Advantage: Ideal for scalping (p1-p2) or swing trading (p4-p5). Benefit: High win rate in volatile markets.
Trend Following Strategy:
Rules: Hold long if ATR trend line is green (up) and MA1 > MA2. Strengthen entry with breakout B.
Filtering: Use only larger period breakouts (p3-p5) with ATR in slow mode.
Exit: Exit on ATR arrow down (reversal) or MA crossover.
Advantage: Captures long-term trends with low drawdown. Benefit: Suitable for passive trading, especially on weekly charts.
Pullback Strategy:
Rules: In an uptrend (green ATR line), enter long when price pulls back to the downtrend line (green pivot low line).
Filtering: No breakout, supported by MA (price above MA). Set stop using ATR deviation.
Exit: New high breakout or ATR reversal.
Advantage: Low-risk entries, captures trend continuations. Benefit: Effective in range-bound markets.
Multi-Timeframe Combination:
Rules: Match short-period (p1) breakouts with long-period (p5) trends (e.g., p5 up + p1 B = long).
Filtering: ATR in medium mode, MAs in golden cross (20>50).
Advantage: Reduces false signals, validates H4 breakouts with D1 trends. Benefit: Suitable for professional traders, with backtesting showing 60%+ win rates.
Risk and Optimization Tips:
Position Sizing: Calculate using ATR (stop-loss distance / 1% risk).
Backtesting: Test in strategy mode; short periods may overtrade, while longer ones may miss opportunities.

Ultimate Bot v5 (Full Visual + Reversal + Sustained Signals)Ultimate Bot v5 is a powerful, all-in-one Pine Script strategy designed for traders who want both clarity and precision in their charts. It combines classic momentum indicators, volatility filters, and reversal logic to highlight high-probability trade opportunities.
🔹 Key Features
Full Visual Mode – Clean and easy-to-read buy/sell markers with large arrows and labels.
EMA Trend Detection – Fast & slow EMA crossovers for trend direction.
RSI + MACD Confirmation – Confirms entries with momentum & strength checks.
Reversal Alerts – Detects sharp drops or spikes for rebound/reversal plays.
Sustained Signal Mode – Highlights stronger continuation trends, not just short-term flips.
ADX Strength Filter (optional) – Filters out weak/noisy signals during sideways markets.
ATR Dynamic Positioning – Arrows adapt to volatility so they’re always visible.
Custom Alerts – Works with TradingView alerts for buy, sell, and reversal signals.
🔹 Why Use It?
This bot is designed to help traders:
✅ Spot early reversals and potential bounce opportunities
✅ Confirm strong momentum moves with multi-indicator checks
✅ Avoid false signals in choppy markets
✅ Trade with confidence using visual clarity

Pajinko DivergencePJK DIVERGENCE is a custom indicator designed to detect market divergence with high precision by combining multiple key market metrics.
It analyzes the relationship between Price Action and key momentum/trend indicators such as RSI, MACD, ADX, and Volume to highlight potential reversal or trend continuation opportunities.
This multi-layer approach allows traders to:
Spot bullish divergence (when price makes lower lows but momentum makes higher lows).
Spot bearish divergence (when price makes higher highs but momentum makes lower highs).
Filter out weak signals by confirming with trend strength (ADX) and volume activity.
How It Works
The script continuously compares price swings with momentum oscillators to identify divergence.
Bullish signals appear when momentum shows strength despite falling prices.
Bearish signals appear when momentum weakens despite rising prices.
ADX is used to confirm trend conditions, and Volume is analyzed to validate market participation.
How to Use
Apply PJK DIVERGENCE to your chart.
Look for bullish or bearish divergence markers and confirm with trend/volume conditions.
Use divergence signals as an early warning for possible trend reversals or as confirmation for existing trade setups.
For best results, combine with the Semi-Auto EA “Cyborg” to manage entries, exits, and risk.
Example Use Cases
Swing Trading: Spot reversal zones before major price movements.
Trend Following: Use divergence to identify potential pullbacks within a trend.
Breakout Trading: Confirm breakout strength by checking for the absence of bearish divergence.

EMA Triad Vanguard Pro [By TraderMan]📌 EMA Triad Vanguard Pro — Advanced Trend & Position Management System
📖 Introduction
EMA Triad Vanguard Pro is an advanced indicator that utilizes three different EMAs (Exponential Moving Averages) to analyze the direction, strength, and reliability of market trends.
It goes beyond a single timeframe, performing trend analysis across 8 different timeframes simultaneously and automatically tracking TP/SL management.
This makes it a powerful reference tool for both short-term traders and medium-to-long-term swing traders.
⚙ How It Works
EMAs:
EMA 21 → Responds quickly to short-term price changes.
EMA 50 → Shows medium-term price direction.
EMA 200 → Determines the long-term market trend.
Trend Direction Logic:
📈 Long Signal: EMA 21 crosses above EMA 200 and EMA 21 > EMA 50.
📉 Short Signal: EMA 21 crosses below EMA 200 and EMA 21 < EMA 50.
Trend Strength Calculation:
Calculates the percentage distance between EMAs.
Strength levels: Very Weak → Weak → Strong → Very Strong.
Multi-Timeframe Analysis:
Analyzes trend direction for: 5min, 15min, 30min, 1H, 4H, Daily, Weekly, and Monthly charts.
Generates an overall market bias from combined results.
Automatic Position Management:
When a position is opened, TP1, TP2, TP3, and SL levels are calculated automatically.
As price reaches these levels, chart labels appear (TP1★, TP2★, TP3★, SL!).
📊 How to Use
1️⃣ Long (Buy) Setup
EMA 21 must cross above EMA 200 ✅
EMA 21 must be above EMA 50 ✅
Overall market bias should be “Bullish” ✅
Entry Price: closing price of the signal candle.
TP levels: calculated based on upward % targets.
SL: a set % below the entry price.
2️⃣ Short (Sell) Setup
EMA 21 must cross below EMA 200 ✅
EMA 21 must be below EMA 50 ✅
Overall market bias should be “Bearish” ✅
Entry Price: closing price of the signal candle.
TP levels: calculated based on downward % targets.
SL: a set % above the entry price.
💡 Pro Tips
Multi-timeframe alignment significantly increases the signal reliability.
If trend strength is “Very Strong”, chances of hitting TP targets are higher.
Weak trends may cause false signals → confirm with extra indicators (RSI, MACD, Volume).
TP levels are ideal for partial take-profits → lock in gains and reduce risk.
📌 Advantages
✅ Displays both trend direction and trend strength at a glance.
✅ Multi-timeframe approach avoids tunnel vision from a single chart.
✅ Automatic TP/SL calculation eliminates manual measuring.
✅ Labeled signal alerts make tracking positions easy and visual.
⚠ Important Notes
No indicator is 100% accurate — sudden news events or manipulations may cause false signals.
Use it together with other technical and fundamental analysis methods.
Signal reliability may decrease in low liquidity markets.
🎯 In summary:
EMA Triad Vanguard Pro combines trend tracking, position management, and multi-timeframe analysis in a single package, helping professional traders reduce workload and make more strategic trades.

OctaScalp Precision Pro [By TraderMan]What is OctaScalp Precision Pro ? 🚀
OctaScalp Precision is a powerful scalping indicator designed for fast, short-term trades. It combines eight technical indicators to generate 💪 high-accuracy buy 📗 and sell 📕 signals. Optimized for scalpers, this tool targets small price movements in low timeframes (1M, 5M). With visual lines 📈, labels 🎯, and Telegram alerts 📬, it simplifies quick decision-making, enhances risk management, and tracks trade performance.
What Does It Do? 🎯
Fast Signals: Produces reliable buy/sell signals using a consensus of eight indicators.
Risk Management: Offers automated Take Profit (TP) 🟢 and Stop Loss (SL) 🔴 levels with a 2:1 reward/risk ratio.
Trend Confirmation: Validates short-term trends with a 30-period EMA zone.
Performance Tracking: Records trade success rates (%) and the last 5 trades 📊.
User-Friendly: Displays market strength, signal type, and trade details in a top-right table.
Alerts: Sends Telegram-compatible notifications for new positions and trade results 📲.
How Does It Work? 🛠️
OctaScalp Precision integrates eight technical indicators (RSI, MACD, Stochastic, Momentum, 200-period EMA, Supertrend, CCI, OBV) for robust analysis. Each indicator contributes 0 or 1 point to a bullish 📈 or bearish 📉 score (max 8 points). Signals are generated as follows:
Buy Signal 📗: Bullish score ≥6 and higher than bearish score.
Sell Signal 📕: Bearish score ≥6 and higher than bullish score.
EMA Zone 📏: A zone (default 0.1%) around a 30-period EMA confirms trends. Price staying above or below the zone for 4 bars validates the direction:
Up Direction: Price above zone, color green 🟢.
Down Direction: Price below zone, color red 🔴.
Neutral: Price within zone, color gray ⚪.
Entry/Exit: Entries are triggered on new signals, with TP (2% profit) and SL (1% risk) auto-calculated.
Table & Alerts: Displays market strength (% bull/bear), signal type, entry/TP/SL, and success rate in a table. Telegram alerts provide instant notifications.
How to Use It? 📚
Setup 🖥️:
Add the indicator to TradingView and use default settings or customize (EMA length, zone width, etc.).
Best for low timeframes (1M, 5M).
Signal Monitoring 🔍:
Check the table: Bull Strength 📗 and Bear Strength 📕 percentages indicate signal reliability.
Confirm Buy (📗 BUY) or Sell (📕 SELL) signals when trendSignal is 1 or -1.
Entering a Position 🎯:
Buy: trendSignal = 1, bullish score ≥6, and higher than bearish score, enter at the entry price.
Sell: trendSignal = -1, bearish score ≥6, and higher than bullish score, enter at the entry price.
TP and SL: Follow the green (TP) 🟢 and red (SL) 🔴 lines on the chart.
Exiting 🏁:
If price hits TP, trade is marked ✅ successful; if SL, marked ❌ failed.
Results are shown in the “Last 5 Trades” 📜 section of the table.
Setting Alerts 📬:
Enable alerts in TradingView. Receive Telegram notifications for new positions and trade outcomes.
Position Entry Strategy 💡
Entry Conditions:
For Buy: Bullish score ≥6, trendSignal = 1, price above EMA zone 🟢.
For Sell: Bearish score ≥6, trendSignal = -1, price below EMA zone 🔴.
Check bull/bear strength in the table (70%+ is ideal for strong signals).
Additional Confirmation:
Use on high-volume assets (e.g., BTC/USD, EUR/USD).
Validate signals with support/resistance levels.
Be cautious in ranging markets; false signals may increase.
Risk Management:
Stick to the 2:1 reward/risk ratio (TP 2%, SL 1%).
Limit position size to 1-2% of your account.
Tips and Recommendations 🌟
Best Markets: Ideal for volatile markets (crypto, forex) and low timeframes (1M, 5M).
Settings: Adjust EMA length (default 30) or zone width (0.1%) based on the market.
Backtesting: Test on historical data to evaluate success rate 📊.
Discipline: Follow signals strictly and avoid emotional decisions.
OctaScalp Precision makes scalping fast, precise, and reliable! 🚀

Dynamic Fib Zones [By TraderMan]📊 Dynamic Fib Zones — Indicator Overview
This indicator automatically plots dynamic Fibonacci levels and zones on your chart based on recent price action, volume, and trend direction. It helps you identify key support and resistance areas where price may react strongly.
🔍 What Does It Do?
Draws Fibonacci retracement levels dynamically over a specified lookback period.
Highlights zones around these Fibonacci levels to give you a price “buffer area” instead of just a line.
Colors the zones green or red based on volume strength and trend direction to signal potential buying or selling pressure.
Uses EMA (Exponential Moving Average) to detect if the trend is up or down.
Shows labels with Fibonacci % levels and exact price for quick reference.
⚙️ How to Use It?
Set your inputs:
Fibonacci Period: How many bars back the Fibonacci levels are calculated.
EMA Period: For trend detection.
Volume Multiplier: How much volume should exceed average to consider the signal strong.
Level Tolerance and Zone Width: Adjust the sensitivity and size of the price zones.
Interpret zones:
Green zones with high volume and price near Fibonacci level in an uptrend = potential buying area.
Red zones with high volume and price near Fibonacci level in a downtrend = potential selling area.
Gray zones = neutral, no strong signal.
Make your trading decisions:
Consider entering long positions near green zones with confirmation from other indicators or price action.
Consider entering short positions near red zones similarly.
Use zone boundaries as dynamic support/resistance for stop loss or take profit placement.
🚀 Tips for Position Opening
Combine with other confirmation tools (candlestick patterns, RSI, MACD, etc.) to avoid false signals.
Watch volume spikes carefully; strong volume near a Fibonacci zone increases the reliability.
Use the EMA trend filter to avoid trading against the main trend.
🎯 Summary
Dynamic Fib Zones give you a powerful, visual edge by combining Fibonacci, volume, and trend signals — making your entries and exits smarter and more precise!
Happy Trading! 📈✨

TrendGradient [By TraderMan]TrendGradient Indicator: What It Does, How It Works, and How to Use It 📊✨
The **TrendGradient ** indicator is a Pine Script tool designed for the TradingView platform, assisting traders in trend analysis, generating buy/sell signals, and determining target price (TP) and stop-loss (SL) levels. In this guide, I’ll explain in detail what the indicator does, how it operates, how to use it, and strategies for opening positions. Get ready to dive into this colorful and powerful tool! 🚀
🌟 **What Is TrendGradient and What Does It Do?**
TrendGradient is an indicator that analyzes price movements to identify trend direction and strength while generating actionable buy and sell signals. Here are its core functions:
1. **Trend Tracking**: Uses 38-period and 62-period Exponential Moving Averages (EMAs) to determine the trend direction (bullish or bearish).
2. **Buy/Sell Signals**: Generates signals based on EMA crossovers and crossunders.
3. **Target and Stop Levels**: Calculates entry, take-profit (TP1, TP2, TP3), and stop-loss (SL) levels using the Average True Range (ATR).
4. **Volatility and Trend Analysis**: Visualizes volatility levels (low, medium, high) and trend strength (strong/weak) via ATR and EMA.
5. **Visual Clarity**: Provides a user-friendly interface with colored lines, labels, tables, and shapes.
This indicator is ideal for trend-following traders and can be used for both short-term (scalping/day trading) and long-term strategies. 📈
---
### 🛠️ **How Does TrendGradient Work?**
Let’s break down the indicator’s mechanics step by step:
#### 1. **EMA-Based Trend Analysis** 📉
- **EMA 38 and EMA 62**: The indicator uses 38-period and 62-period Exponential Moving Averages to smooth price data and identify trend direction.
- **EMA 38 > EMA 62**: Bullish trend (uptrend) 📈
- **EMA 38 < EMA 62**: Bearish trend (downtrend) 📉
- EMA crossovers trigger buy/sell signals:
- **Crossover (EMA 38 crosses above EMA 62)**: Buy signal (BUY).
- **Crossunder (EMA 38 crosses below EMA 62)**: Sell signal (SELL).
- The EMAs focus on the last 20 days of data to display recent trends only.
#### 2. **ATR-Based Levels** ⚖️
- **ATR (Average True Range)**: Measures price volatility and is used to calculate entry, TP, and SL levels.
- **Entry Price**: For buys, the closing price plus an ATR multiplier; for sells, the closing price minus an ATR multiplier.
- **Take-Profit Levels (TP1, TP2, TP3)**: Calculated by adding/subtracting ATR multiples (default: 2.0, 4.0, 6.0) to/from the entry price.
- **Stop-Loss (SL)**: Set at a distance from the entry price using an ATR multiplier (default: 2.0 + additional SL).
- These levels are visualized on the chart with colored lines (yellow: entry, green: TP1, teal: TP2, blue: TP3, red: SL) and labels.
#### 3. **Signal and Status Visualization** 🖼️
- **Lines and Labels**: Buy/sell signals are marked with green "BUY" and red "SELL" labels on the chart.
- **Table**: A table in the top-right corner summarizes signal status, entry/TP/SL levels, trend strength, volatility, and trend direction.
- **Color Coding**:
- Green: Bullish trend, buy signal, or TP achievements.
- Red: Bearish trend, sell signal, or SL triggered.
- Yellow, teal, blue: Entry and TP levels.
- **Bar Coloring**: Bars are colored green (bullish) or red (bearish) based on EMA alignment.
#### 4. **TP/SL Monitoring** ✅❌
- The indicator checks if the price hits TP or SL levels and displays labels like "✔️ TP Achieved" or "❌ SL Stopped Out."
- When a TP or SL is hit, the position status updates (e.g., "In Progress ⏳", "Successful ✅", or "Failed ❌").
#### 5. **Volatility and Trend Strength** 📊
- **Volatility (ATR)**: Classified as "Low" (red), "Medium" (orange), or "High" (green) based on the ATR’s position within its 50-bar range.
- **Trend Strength**: If EMA 38 > EMA 62, the trend is "Strong" (green); otherwise, it’s "Weak" (red).
---
### 📋 **How to Use TrendGradient?**
Follow these steps to effectively use TrendGradient:
#### 1. **Add the Indicator to TradingView** 🖥️
- In TradingView, search for "TrendGradient " in the **Indicators** menu and add it to your chart.
- Use default settings or customize parameters like ATR period, multipliers, and display duration (default: 20 days) in the **Settings** menu.
#### 2. **Identify Signals** 🔍
- **Buy Signal (BUY)**: Appears when a green "BUY" label is displayed and EMA 38 crosses above EMA 62.
- **Sell Signal (SELL)**: Appears when a red "SELL" label is displayed and EMA 38 crosses below EMA 62.
- Check the top-right table for signal status ("BUY", "SELL", or "-") and position levels (Entry, TP1, TP2, TP3, SL).
#### 3. **Opening a Position** 🚪
- **Long Position (Buy)**:
1. When a "BUY" signal appears, check the entry price (yellow line).
2. Open a position at or near the entry price.
3. Set TP1, TP2, TP3 (green, teal, blue lines) and SL (red line) as targets/stops.
- **Short Position (Sell)**:
1. When a "SELL" signal appears, check the entry price.
2. Open a position at or near the entry price.
3. Use TP and SL levels as targets/stops.
- **Note**: ATR-based levels adjust dynamically to market volatility, ensuring adaptability.
#### 4. **Position Management** 🛡️
- **Take-Profit (TP)**: Realize profits when the price hits TP1, TP2, or TP3. For example, close part of the position at TP1 and hold the rest for TP2/TP3.
- **Stop-Loss (SL)**: Close the position if the price hits the SL level ("❌ SL Stopped Out" appears).
- **Partial Closes**: Use multiple TP levels to scale out of positions incrementally.
#### 5. **Trend and Volatility Analysis** 📊
- **Trend Direction and Strength**: The table shows whether the trend is "Up" or "Down" and its strength ("Strong" or "Weak"). Strong trends may warrant more aggressive positions.
- **Volatility**: ATR-based volatility indicators help gauge market conditions. High volatility (green) suggests larger price moves, while low volatility (red) indicates calmer markets.
#### 6. **Risk Management** ⚠️
- Always use the SL level and assess the risk/reward ratio (e.g., 2:1 for TP1, 4:1 for TP2).
- In low volatility (red), consider smaller positions; in high volatility (green), expect larger moves.
---
### 🛠️ **Example Position Opening Scenario**
**Scenario: Long Position**
- **Situation**: EMA 38 crosses above EMA 62, and a green "BUY" label appears.
- **Entry Price**: 100 (yellow line).
- **TP Levels**: TP1: 104, TP2: 108, TP3: 112.
- **SL Level**: 96.
- **Strategy**:
1. Open a long position at 100.
2. Close 50% of the position at TP1 (104), hold the rest for TP2 (108) or TP3 (112).
3. Exit fully if the price hits SL (96).
- **Table Status**: "Signal: BUY", "Position Status: In Progress ⏳", "Trend Strength: Strong", "Volatility: High".
**Scenario: Short Position**
- **Situation**: EMA 38 crosses below EMA 62, and a red "SELL" label appears.
- **Entry Price**: 100.
- **TP Levels**: TP1: 96, TP2: 92, TP3: 88.
- **SL Level**: 104.
- **Strategy**: Manage the position similarly, scaling out at TP levels.
---
### 💡 **Tips and Suggestions**
1. **Timeframe**: The indicator works across timeframes (1H, 4H, daily). Short-term traders can use 1H-4H, while long-term traders may prefer daily charts.
2. **Combine with Other Indicators**: Use RSI, MACD, or support/resistance levels to confirm signals.
3. **Backtesting**: Test the strategy on historical data to evaluate performance.
4. **Customization**: Adjust ATR multipliers or EMA periods to suit your market or strategy.
5. **Discipline**: Stick to signals and avoid emotional decisions.
---
### 🎨 **Visual Features**
- **Colored Lines and Labels**: Entry, TP, and SL levels are displayed with colored lines (yellow, green, teal, blue, red) for clarity.
- **Table**: The top-right table summarizes all key information (signal, levels, trend, volatility).
- **Bar Coloring**: Green bars for bullish trends and red bars for bearish trends make trend direction easy to spot.
- **Emojis**: Position status is enhanced with emojis like ⏳ (in progress), ✅ (successful), and ❌ (failed) for visual appeal.
---
### ⚠️ **Warnings and Limitations**
- **Market Conditions**: The indicator performs best in trending markets; it may produce false signals in ranging markets.
- **Risk Management**: Always use proper risk/reward ratios and risk only a small portion of your capital.
- **Lag**: EMAs are lagging indicators, so signals may be delayed in fast-moving markets.
- **Customization Needs**: Default settings may not suit all markets; test and optimize as needed.
---
### 🌟 **Conclusion**
TrendGradient is a user-friendly, visually appealing indicator for trend tracking and automated level calculation. It generates signals via EMA crossovers, calculates dynamic TP/SL levels with ATR, and presents all information clearly through tables, lines, and labels. By using this tool with discipline, you can make more informed and successful trading decisions! 🚀
If you have further questions or need help customizing the indicator, feel free to ask! 💬 Good luck and happy trading! 🍀

EMA ZONE MASTER [By TraderMan]🟢 EMA Zone Master Indicator Explanation 🚀
🌟 What is the EMA Zone Master?
The EMA Zone Master is a powerful TradingView Pine Script indicator designed to help traders identify trends, entry points, and manage trades with precision. It leverages a 200-period EMA (Exponential Moving Average) to create a dynamic zone for spotting bullish 📈 and bearish 📉 trends. The indicator provides clear buy/sell signals, take-profit (TP) levels, and stop-loss (SL) levels, making it ideal for both novice and experienced traders! 💪
🔍 How Does It Work?
The indicator uses the 200-period EMA as its core, surrounded by a zone defined by a percentage offset (default 0.3%). Here's how it operates:
Trend Detection 🧠:
The price's position relative to the EMA zone determines the trend:
Above the zone (with tolerance and minimum distance) signals a bullish trend (BUY 📈).
Below the zone signals a bearish trend (SELL 📉).
A neutral trend occurs when the price is within the zone or lacks momentum.
A trend is confirmed after a set number of bars (default 3) to filter out noise. 🔎
Trade Signals 🚦:
Buy Signal: Triggered when the price breaks above the EMA zone with confirmation.
Sell Signal: Triggered when the price breaks below the EMA zone with confirmation.
Signals are visualized with labels ("BUY" or "SELL") on the chart for clarity. ✅
Position Management 🎯:
Entry Price: Set at the closing price when a signal is triggered.
Take-Profit Levels: Three TP levels (TP1, TP2, TP3) are calculated based on a Risk/Reward Ratio (default 0.7).
Stop-Loss: Calculated using the ATR (Average True Range) with a multiplier (default 6.0) for volatility-based protection. 🛡️
Lines and labels for entry, TP, and SL are drawn on the chart for easy tracking.
Trend Strength 💪:
The indicator calculates trend strength (0-100%) and categorizes it as Very Strong, Strong, Moderate, Weak, or Very Weak. This helps gauge the reliability of the trend. 🌡
Analysis Comment 📝:
A dynamic comment provides professional insights based on trend strength, guiding traders on whether to act or wait. 🧑💼
Visuals & Alerts 🔔:
The EMA, zone boundaries, and candlestick colors change based on the trend (green for bullish, red for bearish, gray for neutral).
A table in the top-right corner summarizes key data: trend direction, strength, entry price, TP/SL levels, and success rate.
Alerts are generated with detailed trade information when a new signal appears.
🛠 How to Use It?
Setup on TradingView ⚙️:
Add the EMA Zone Master to your chart via the TradingView Pine Script editor.
Customize settings like EMA Length (default 200), Zone Width (0.3%), ATR Period (50), and Risk/Reward Ratio (0.7) to suit your trading style. 🛠
Interpreting Signals 📊:
Buy Signal (AL): Look for a "BUY" label and green candlesticks when the price breaks above the EMA zone. 📈
Sell Signal (SAT): Look for a "SELL" label and red candlesticks when the price breaks below the EMA zone. 📉
Check the table for trend strength and analysis comments to confirm the signal's reliability.
Opening a Position 💸:
Long Position: Enter a buy trade when a "BUY" signal appears. Set your take-profit at TP1, TP2, or TP3 and stop-loss at the SL level shown on the chart.
Short Position: Enter a sell trade when a "SELL" signal appears. Use the TP and SL levels provided.
The indicator automatically plots these levels as lines and labels for easy reference. 🎯
Managing Trades 🕒:
Monitor the trade's progress via the table and labels.
The indicator tracks if TP1, TP2, or TP3 is hit or if the trade stops out, updating the Last Result in the table (e.g., "✅ TP1 SUCCESS" or "❌ STOPPED OUT").
Use the Success Rate (displayed in the table) to gauge historical performance (75% for BUY, 65% for SELL, 50% for NEUTRAL).
Using Alerts 🔔:
Set up alerts in TradingView to receive notifications when a buy or sell signal is triggered.
The alert message includes the trend, strength, entry price, TP/SL levels, success rate, and analysis comment for quick decision-making.
📈 How to Open a Position?
Wait for a Signal: Ensure a "BUY" or "SELL" label appears, and the trend strength is at least Moderate (40%+) for higher confidence. ✅
Check the Table: Review the trend direction, strength, and analysis comment to confirm the trade setup. 📊
Enter the Trade:
For a Buy: Enter at the entry price shown, set TP1/TP2/TP3 and SL as indicated by the lines/labels.
For a Sell: Same process, but for a short position.
Monitor: Watch for TP or SL hits. The indicator will update the table with the result (e.g., "✅ TP3 SUCCESS"). 🕒
Risk Management: Always adhere to the stop-loss level to limit losses, and consider partial profit-taking at TP1 or TP2 for safer trading. 🛡️
🎉 Why Use EMA Zone Master?
Clear Signals: Easy-to-read buy/sell signals with visual cues. 🚦
Automated Levels: Pre-calculated TP and SL levels save time and reduce errors. 🧮
Trend Strength Insight: Helps avoid weak trends and focus on high-probability setups. 💪
Professional Analysis: Dynamic comments guide your trading decisions. 🧑💼
Customizable: Adjust settings to match your trading style or market conditions. ⚙️
Alert System: Stay informed with detailed alerts for timely action. 🔔
⚠️ Tips for Success
Confirm with Other Tools: Use additional indicators (e.g., RSI, MACD) to validate signals. 🔍
Test First: Backtest the indicator on your preferred market/timeframe to understand its performance. 📉
Risk Management: Always use proper position sizing and respect stop-loss levels. 🛑
Higher Timeframes: The indicator works best on higher timeframes (e.g.,15MİN, 1H, 4H, Daily) for stronger signals. ⏰
Happy trading with EMA Zone Master! 🚀 Let it guide you to smarter, more confident trades. 💰 Feel free to tweak settings and share your results! 😊

Universal Futures Signals Pro – Next-Gen Day Trading IndicatorThe Universal Futures Signals Pro is a powerful, all-in-one day trading toolkit designed for futures traders seeking precision, confidence, and consistency. Whether you're trading ES, MES, NQ, MNQ, or other popular futures contracts, this indicator delivers real-time signals and advanced analytics tailored for high-performance intraday trading.
🔍 Key Features:
Smart Buy/Sell Signals based on multi-factor confluence (trend, momentum, volume, volatility).
EMA, VWAP, RSI, MACD & Order Block integration for accurate signal generation.
Signal Clustering Detector to identify high-probability trade zones.
Dynamic Risk Management: Helps define stop loss and target areas for funded evaluations.
Session Filters (RTH, ETH) and Smart Money Concepts for cleaner setups.
Professional Dashboard showing trend state, trade status, and signal count.
Alerts for trade entries, exits, signal clusters, and trend shifts.
Customizable Settings: Tailor everything from sensitivity to color schemes.
Who is it for?
Prop firm traders looking to pass evaluation accounts.
Futures scalpers and intraday traders who value precision.
Traders seeking a structured edge in volatile markets.
Works Best On:
Instruments: ES, MES, NQ, MNQ, RTY, YM, CL, GC, etc.
Timeframes: 1m to 15m (optimized for intraday precision)

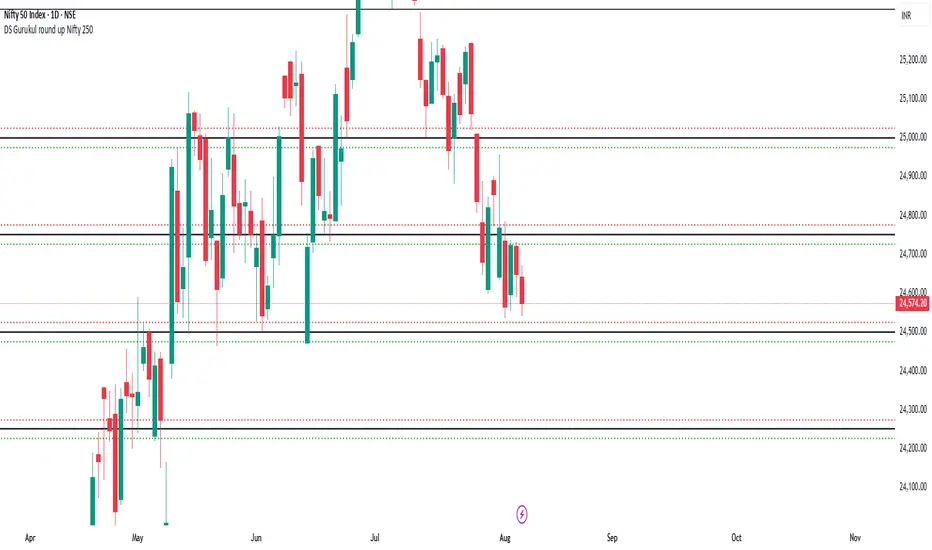
DS Gurukul round up Nifty 250Roundup (Support & Resistance Indicator) For Nifty 50
By DS Gurukul
Version : 1.0
To be used only for Nifty 50.
Indicator Overview
The Round Figure Indicator identifies key psychological support and resistance levels based on round numbers. These levels often act as strong turning points in price action due to trader psychology and institutional order placement.
How It Works
Key Levels:
Mid Band (Black Solid Line): Major round number
Upper Band (Green Solid Line): Mid Band (resistance)
Lower Band (Red Solid Line): Mid Band (support)
Sub-Bands (Dotted Lines): ±0.10 levels for tighter zones
Alerts: Triggers when price touches any band, signaling potential reversals or breakouts.
Trading Strategy
✅ Bounce Trades:
Buy near Lower Band or Mid Sub-Lower with bullish confirmation (e.g., hammer candle).
Sell near Upper Band or Mid Sub-Upper with bearish rejection (e.g., shooting star).
✅ Breakout Trades:
Enter long on a close above Upper Band with volume.
Enter short on a close below Lower Band with momentum.
⚠️ Risk Management:
Place stops just beyond the opposite sub-band.
Avoid trading if price is stuck between mid/sub-bands (choppy market).
Why It Works
Round numbers attract limit orders (support/resistance).
Institutions use these levels for stop placements and profit targets.
Works across all timeframes (scalping to swing trading).
🔔 Tip: Combine with RSI/MACD for higher-probability trades!
DS Gurukul round up Bank 500Roundup (Support & Resistance Indicator) For Bank Nifty
By DS Gurukul
Version : 1.0
To be used only for Bank Nifty.
Indicator Overview
The Round Figure Indicator identifies key psychological support and resistance levels based on round numbers. These levels often act as strong turning points in price action due to trader psychology and institutional order placement.
How It Works
Key Levels:
Mid Band (Black Solid Line): Major round number
Upper Band (Green Solid Line): Mid Band (resistance)
Lower Band (Red Solid Line): Mid Band (support)
Sub-Bands (Dotted Lines): ±0.10 levels for tighter zones
Alerts: Triggers when price touches any band, signaling potential reversals or breakouts.
Trading Strategy
✅ Bounce Trades:
Buy near Lower Band or Mid Sub-Lower with bullish confirmation (e.g., hammer candle).
Sell near Upper Band or Mid Sub-Upper with bearish rejection (e.g., shooting star).
✅ Breakout Trades:
Enter long on a close above Upper Band with volume.
Enter short on a close below Lower Band with momentum.
⚠️ Risk Management:
Place stops just beyond the opposite sub-band.
Avoid trading if price is stuck between mid/sub-bands (choppy market).
Why It Works
Round numbers attract limit orders (support/resistance).
Institutions use these levels for stop placements and profit targets.
Works across all timeframes (scalping to swing trading).
🔔 Tip: Combine with RSI/MACD for higher-probability trades!

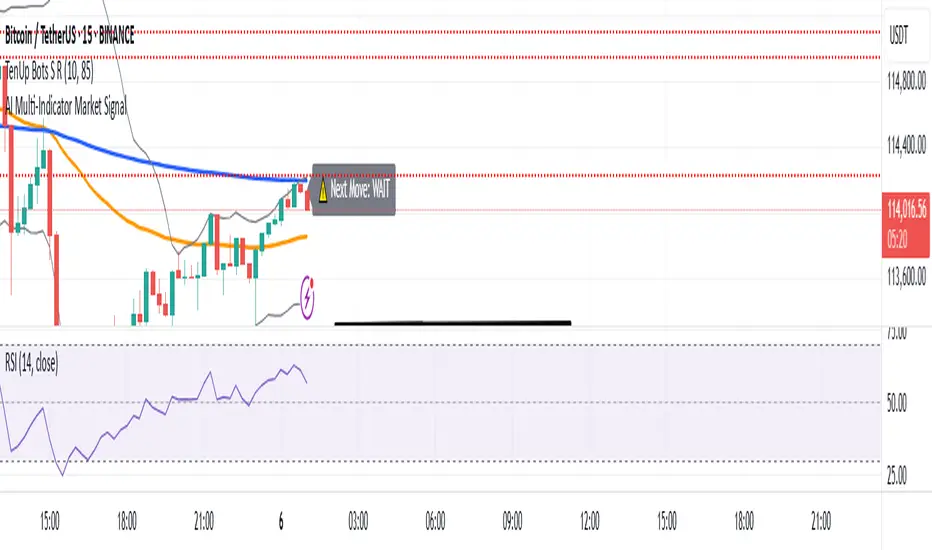
Multi-Indicator Market SignalMulti-Indicator Market Signal with rsi , macd ,volume buy and sell signal
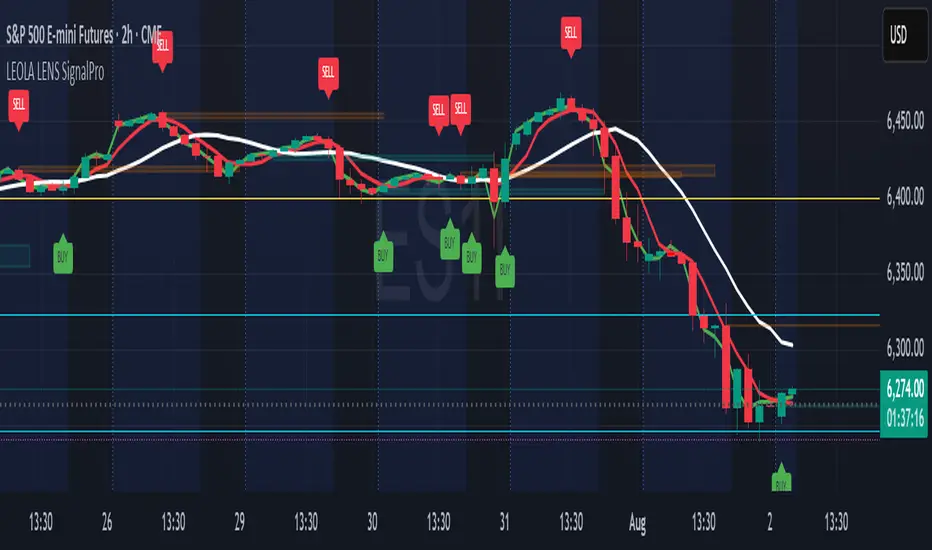
Leola Lens SignalPro📌 Leola Lens SignalPro — Structure-Aware Momentum Overlay (Invite-Only)
This script is designed for traders who prioritize clear structure, liquidity trap zones, and momentum transitions. It provides adaptive visual overlays that align with key decision points — emphasizing structure over lagging indicators.
________________________________________
⚙️ Core Operating Modes
✅ Momentum Shift Mode (Always Active)
Tracks microstructure shifts using volatility compression, imbalance reactions, and adaptive logic for directional bias.
⚡ Scalper Mode (Optional)
Activates fast-response overlays for 1m–15m charts — tuned for crypto, indices, and intraday setups.
🛡 Safeguard Mode (Optional)
Applies volume and exhaustion filters for higher timeframe or conservative entries, ideal for swing traders.
________________________________________
📦 Liquidity Control Box (LCB) Logic
🔵 Blue Box = Bullish Control
• Break above → continuation likely
• Break below → caution for reversal
🟧 Orange Box = Bearish Control
• Break below → continuation likely
• Break above → caution for squeeze
Use the last visible box for bias.
Box edges = confluence zones.
Box overlaps = consolidation → avoid impulsive trades.
________________________________________
🧠 Signal Logic & Concept
Built using a custom structural engine, not derived from public scripts like RSI, MACD, or WaveTrend.
The overlays aim to capture price behavior often aligned with institutional concepts, such as:
• Order Blocks
• Liquidity Sweeps
• Trap Reversals
• Mitigation Moves
Pairs well with SMC-style analysis and order-flow-based trading.
________________________________________
🟡 Visual Signal Layers
• BUY / SELL Labels → Appear near structure flips and trap zones
• Yellow Label → High-risk trend shift zone
• LCB Boxes → Real-time market control zones
• Green/Red Liquidity Zones → Absorption or rejection
• MA Overlays → Adaptive slope-based guidance (optional)
• Pink Lines → High-reactivity reversal zones
• Yellow Line → Soft S/R (psychological pivot)
________________________________________
🎯 Suggested Entry & Exit Cues (Educational Use Only)
✅ Entry
• BUY near Blue LCB + liquidity reaction
• SELL after extended rallies into Orange LCB + trap behavior
• ⚠ Avoid trades directly at Yellow Labels unless other context supports
✅ Exit
• On opposite label after structure break
• On formation of opposite LCB
• Near major liquidity zones or pink levels
🧪 Always backtest label behavior to fit your strategy before use.
________________________________________
🔍 Originality Justification
This script introduces a non-indicator-based approach to structure detection — combining real-time volatility response, adaptive liquidity logic, and multi-mode filtering. It avoids conventional oscillators in favor of clarity-driven visual overlays, offering a novel experience especially useful to discretionary traders.
________________________________________
⚠️ Disclaimer
This script is for educational and informational purposes only. It does not constitute financial advice or a trading signal. Always validate performance with backtesting and forward testing before live use.
________________________________________
Leola Lens Footprint📌 Leola Lens Footprint — Market Memory Overlay (Invite-Only)
This invite-only script is built to visualize market memory by identifying historically reactive zones — where price previously encountered resistance, support, or decision-making friction.
Unlike predictive models or indicator-driven systems, Footprint focuses only on price behavior that has already occurred, using confirmed reaction clusters to highlight likely areas of future influence.
________________________________________
🔍 What It Does
• Detects zones where price has reacted multiple times, showing clear rejection, breakout, or consolidation behavior
• Plots these levels only after market confirmation — no projections or lagging indicators
• Designed for clean structural reading across all timeframes and asset classes (crypto, stocks, forex, commodities)
________________________________________
🟡 Visual Elements
• 🟣 Purple Zones → High-impact memory zones with consistent historical rejection
• 🟤 Brown Zones → Fresh rejection clusters (recent demand/supply zones)
• 🟡 Yellow Line → Psychological pivot zone/Key decision points formed from repeated reactions.
• 🩷 Pink Lines → Pullback or reversal zones (support/resistance traps)
• Adaptive zone shading and slope-based logic enhances readability
________________________________________
📊 Best Suited For:
• Price-action traders who focus on confirmed historical behavior, not speculative levels
• Scalpers and swing traders looking to trade retests and rejection entries
• Discretionary traders wanting a stable visual map of structure without noise
________________________________________
🔧 Originality & Logic
This script uses original rule-based logic to cluster and validate levels only after real-world confirmation.
It does not use RSI, MACD, MAs, volume, or any traditional indicator input.
Instead, it tracks zone memory based on how price respects or invalidates key levels over time — making it adaptive to both trending and ranging environments.
There is no repainting or forward projection — all levels appear only after market structure confirms relevance.
________________________________________
⚠️ Disclaimer
This tool is for educational and informational purposes only. It does not constitute trading advice or a financial recommendation. Always validate visual overlays with your own risk framework and backtesting before live use.
________________________________________

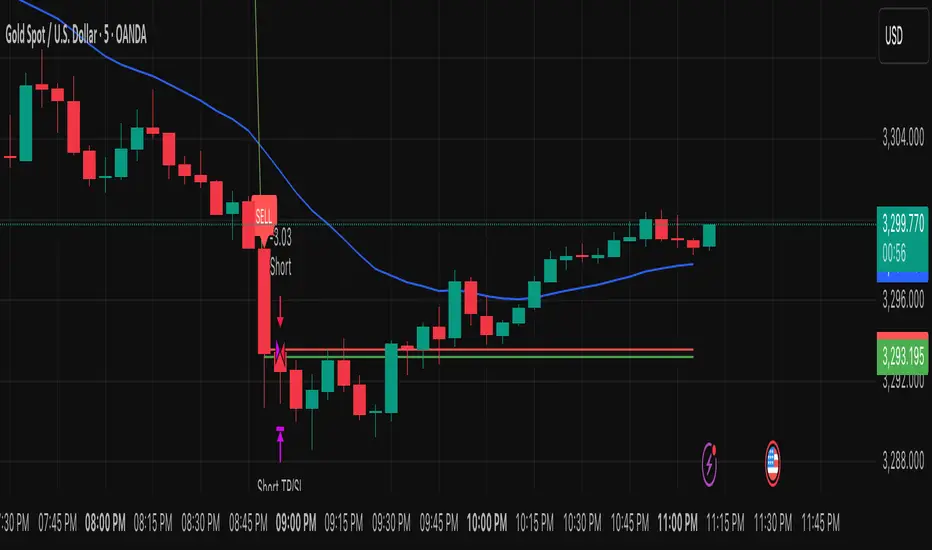
Leola Lens Pro📌 Leola Lens Pro — Expansion, Trap & Structure Map (Invite-Only)
This invite-only overlay is designed to give traders enhanced clarity around liquidity shifts, trap zones, and expansion/reversion mechanics — across all timeframes and market types.
Built as an evolution of Leola Lens Standard, the Pro version integrates a more refined structural engine to highlight real-time reaction zones with greater context sensitivity.
________________________________________
🔍 What It Displays
• Dynamic support/resistance zones that evolve with price
• Expansion & reversion levels — visualize where moves may exhaust or reverse
• Liquidity sweep detection to catch trap-based market setups
• Cluster zones that signal areas prone to breakouts or failed entries
________________________________________
🟡 Visual Markers
• 🟡 Yellow Line → Psychological pivot zone
• 🩷 Pink Lines → Pullback or reversal zones (support/resistance traps)
• Adaptive zone shading and slope-based logic enhances readability
________________________________________
📊 Best Suited For:
• Traders identifying value breaks, imbalance zones, or liquidity voids
• Scalpers catching early trap setups before momentum expands
• Swing traders aiming to enter mean reversion trades post-expansion
________________________________________
🔧 Technical Approach & Originality
Leola Lens Pro is powered by original proprietary logic — it does not rely on public Pine scripts, built-in indicators, or volume-based techniques.
• No use of RSI, MACD, MAs, Bollinger Bands, or volatility indicators
• Not a predictive tool — it responds to confirmed structure, slope, and price reaction
• Designed for clarity in both trending and ranging conditions
• Visual performance optimized for 15-minute charts but remains timeframe-agnostic
This implementation provides a novel overlay experience focused on structural adaptability and trap awareness, not traditional indicator signals.
________________________________________
⚠️ Disclaimer
This script is provided for educational and analytical purposes only. It does not constitute financial advice or trade recommendations. Always validate tools through personal testing and risk frameworks.
________________________________________

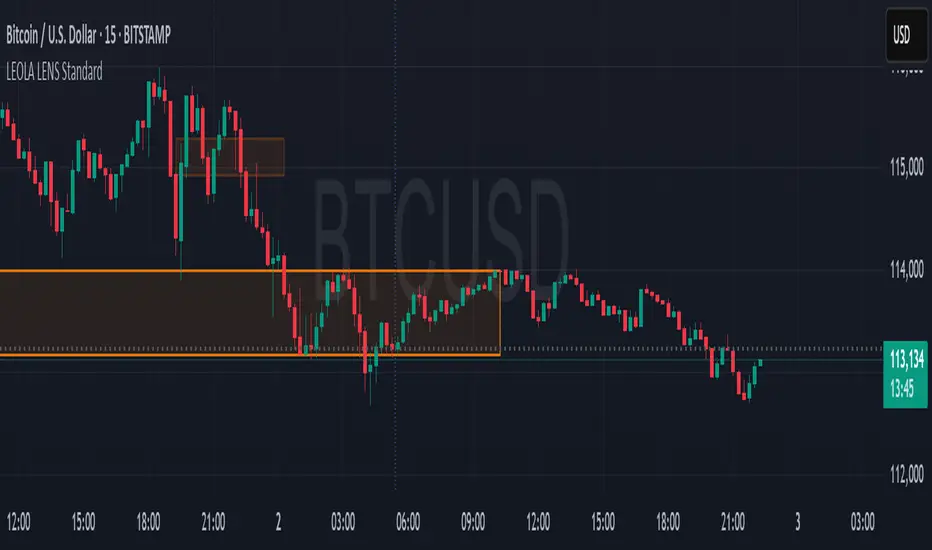
Leola Lens Standard📌 Leola Lens Standard — Structural Reaction Map (Invite-Only)
Leola Lens Standard is a closed-source overlay designed to map structural levels, reaction zones, and liquidity shifts — across all major market types and timeframes.
This version focuses on clean, adaptive visuals that help traders identify reaction-prone areas without relying on conventional indicators.
________________________________________
🔍 What It Displays
• Dynamic zones that shift based on evolving price behavior
• Support and resistance clusters around consolidation or expansion phases
• Upper and lower range boundaries to track accumulation/distribution conditions
• Transition zones where false breakouts or traps are likely to occur
________________________________________
🧠 Technical Approach & Originality
This tool uses custom-coded structural logic, not derived from Pine Script libraries or public indicator templates.
• No use of RSI, MACD, MAs, Bollinger Bands, or volume-based profiles
• Reactions are mapped based on confirmed price behavior, not forecasts
• All zones are generated visually — no manual inputs required
• Compatible with trend, range, or chop market conditions
Its focus on structure-based clarity helps traders cut through noise, particularly in high-volatility environments.
________________________________________
🧩 Best Use Cases
• Intraday traders seeking traps and fakeouts at key levels
• Swing traders mapping range-to-trend transitions or retests
• Market-neutral setups where visual structure is more actionable than signal indicators
• Works across crypto, equities, forex, and commodities
________________________________________
⚠️ Disclaimer
This script is provided for educational and analytical purposes only. It is not financial advice and should not be used to make trading decisions without proper risk assessment.
________________________________________
MA Crossover Detector
The Moving Average Crossover Detector is a custom indicator that visually shows buy and sell signals clearly on the chart. based on the crossing of two moving averages — a popular and beginner-friendly tool in technical analysis.
It plots two moving averages — One fast (short period) and one slow (long period) — and highlights crossover points:
✅ Buy Signal (Golden Cross) – When the fast MA crosses above the slow MA.
❌ Sell Signal (Death Cross) – When the fast MA crosses below the slow MA.
✅ Features
Visual: Clearly shows crossovers on the chart.
Customizable: Choose periods, types, styles, etc.
Alert-ready: You can set alerts for crossovers.
The Moving Average (MA) Crossover Strategy is one of the simplest and most widely used strategies in technical analysis for trading stocks, forex, crypto, and other markets. It relies on the interaction between two moving averages to generate buy and sell signals.
Core Components
Short-Term Moving Average (Fast MA) : Reacts quickly to price changes (e.g., 9-period or 20-period).
Long-Term Moving Average (Slow MA) : Reacts more slowly to price changes (e.g., 21-period or 200-period).
How the Strategy Works
Bullish Crossover (Golden Cross):
Occurs when the fast MA crosses above the slow MA. Interpreted as a buy signal, indicating a potential uptrend.
Bearish Crossover (Death Cross):
Occurs when the fast MA crosses below the slow MA. Interpreted as a sell signal, indicating a potential downtrend.
Common Variants
Short-term trading
9 EMA
21 EMA
Swing trading
20 SMA
50 SMA
Long-term investing
50 SMA
200 SMA
Pros
Easy to understand and implement
Works well in trending markets
Can be automated for backtesting and execution
Cons
Lagging indicator: MAs are based on past prices, so signals come after the move has started.
Choppy markets = whipsaws: Generates false signals in sideways/range-bound conditions.
May underperform in volatile or mean-reverting environments
Tips for Improvement
Use confirmation tools : e.g., RSI, MACD, volume analysis, price action
Add filters : Trend filter (ADX), volatility filter (ATR), or time filter (session-based)
Combine with price structure : Support/resistance, breakouts, pullbacks

TPC Strategy XAUUSD - M5 with Fixed SL/TPThis script implements a trend-following strategy for XAUUSD on the 5-minute chart, using 200 EMA and 21 EMA to filter direction. Entries are triggered based on RSI, MACD crossovers, and price action alignment. It includes fixed Stop Loss (15 pips) and Take Profit (22.5 pips) with visual SL/TP lines, BUY/SELL labels, and alert conditions for automated notifications. Designed for intraday scalping and low-risk entries during trending conditions.
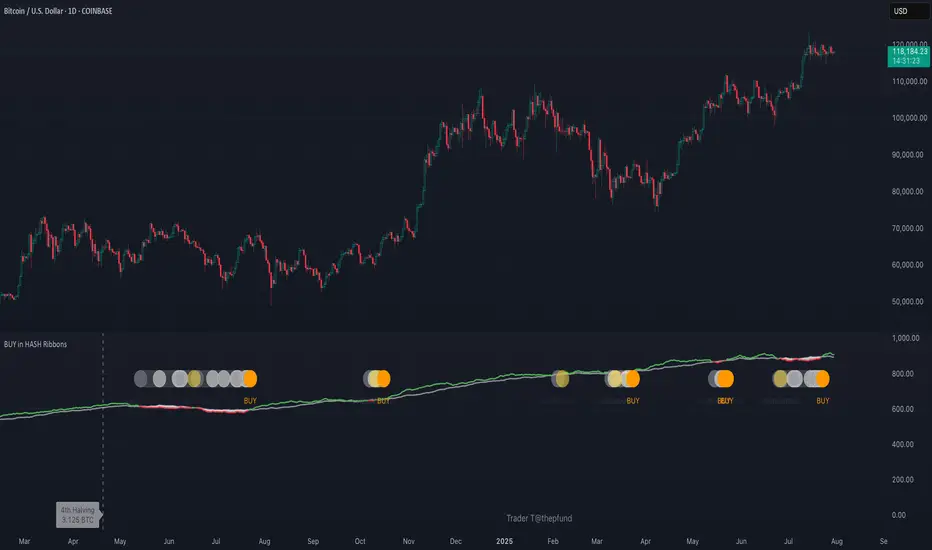
BUY in HASH RibbonsHash Ribbons Indicator (BUY Signal)
A TradingView Pine Script v6 implementation for identifying Bitcoin miner capitulation (“Springs”) and recovery phases based on hash rate data. It marks potential low-risk buying opportunities by tracking short- and long-term moving averages of the network hash rate.
⸻
Key Features
• Hash Rate SMAs
• Short-term SMA (default: 30 days)
• Long-term SMA (default: 60 days)
• Phase Markers
• Gray circle: Short SMA crosses below long SMA (start of capitulation)
• White circles: Ongoing capitulation, with brighter white when the short SMA turns upward
• Yellow circle: Short SMA crosses back above long SMA (end of capitulation)
• Orange circle: Buy signal once hash rate recovery aligns with bullish price momentum (10-day price SMA crosses above 20-day price SMA)
• Display Modes
• Ribbons: Plots the two SMAs as colored bands—red for capitulation, green for recovery
• Oscillator: Shows the percentage difference between SMAs as a histogram (red for negative, blue for positive)
• Optional Overlays
• Bitcoin halving dates (2012, 2016, 2020, 2024) with dashed lines and labels
• Raw hash rate data in EH/s
• Alerts
• Configurable alerts for capitulation start, recovery, and buy signals
⸻
How It Works
1. Data Source: Fetches daily hash rate values from a selected provider (e.g., IntoTheBlock, Quandl).
2. Capitulation Detection: When the 30-day SMA falls below the 60-day SMA, miners are likely capitulating.
3. Recovery Identification: A rising 30-day SMA during capitulation signals miner recovery.
4. Buy Signal: Confirmed when the hash rate recovery coincides with a bullish shift in price momentum (10-day price SMA > 20-day price SMA).
⸻
Inputs
Hash Rate Short SMA: 30 days
Hash Rate Long SMA: 60 days
Plot Signals: On
Plot Halvings: Off
Plot Raw Hash Rate: Off
⸻
Considerations
• Timeframe: Best applied on daily charts to capture meaningful miner behavior.
• Data Reliability: Ensure the chosen hash rate source provides consistent, gap-free data.
• Risk Management: Use alongside other technical indicators (e.g., RSI, MACD) and fundamental analysis.
• Backtesting: Evaluate performance over different market cycles before live deployment.